 Leoric Watch
Uptime monitoring + white-label status pages + AI diagnosis
Know when a site is down. Show customers what is happening. Diagnose why it happened.
Leoric Watch monitors websites and APIs, publishes client-ready status pages, and uses AI Deep Diagnosis to read incident-time evidence from the tools you already use.
- Monitor
- Uptime, degraded response, SSL, domain expiry, heartbeat, and API checks.
- Communicate
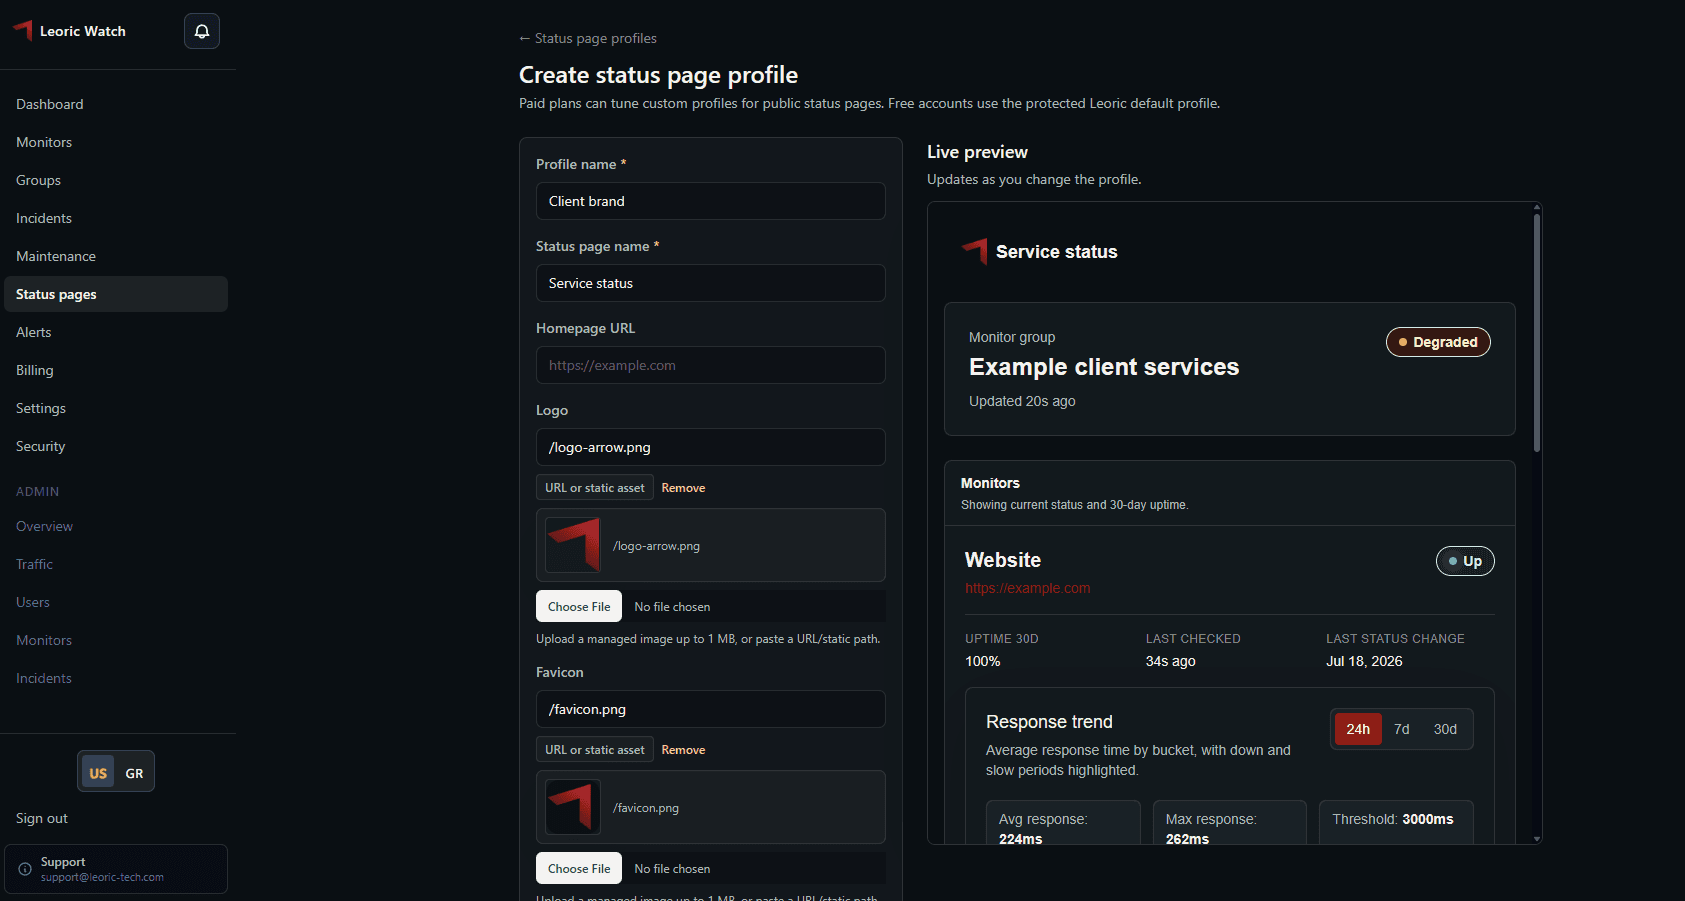
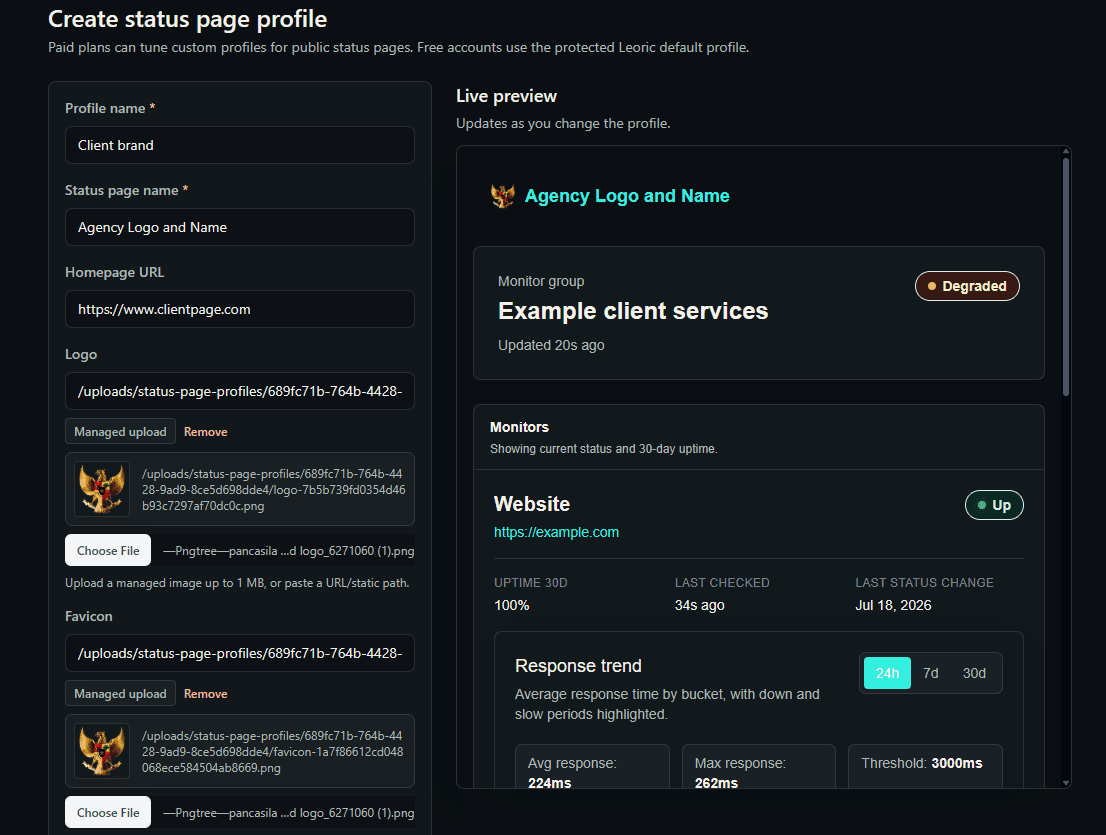
- White-label status pages on your client's domain, with grouped services and clean incident context.
- Diagnose
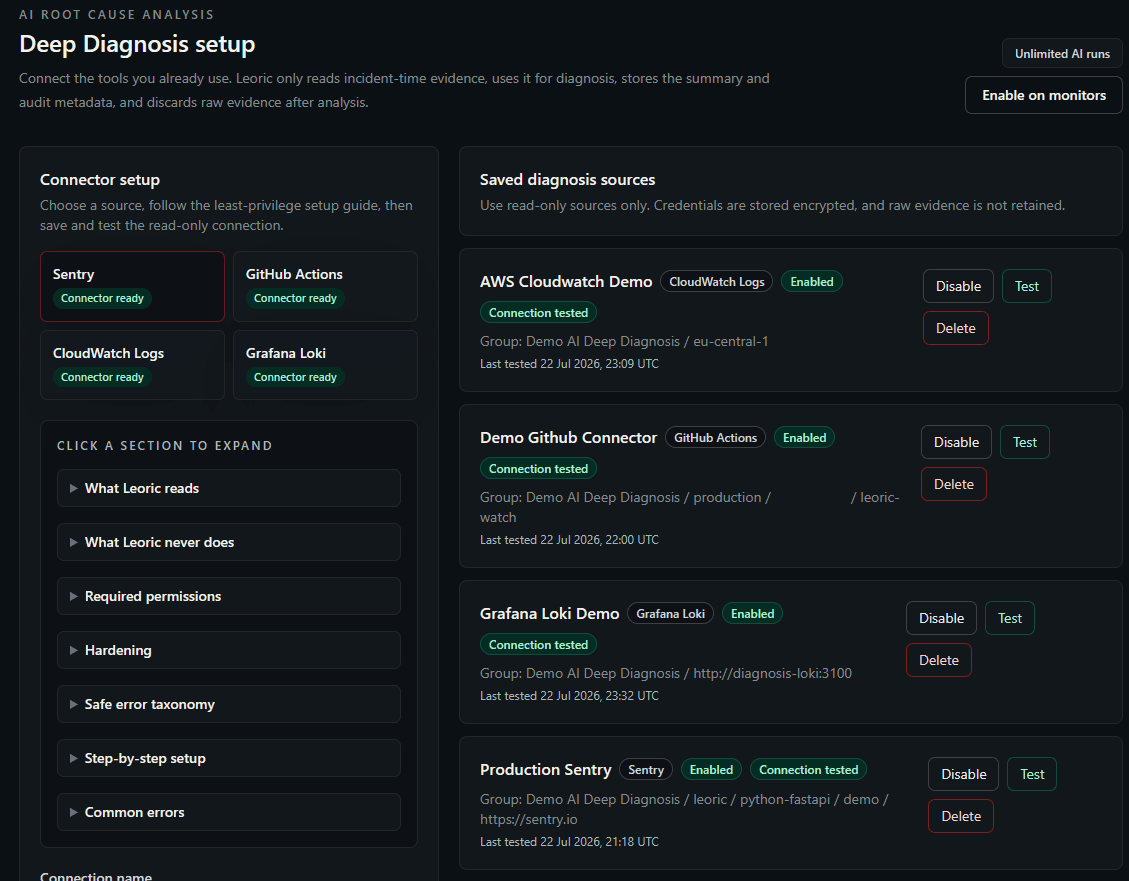
- AI Deep Diagnosis connects to Sentry, GitHub Actions, CloudWatch, and Loki to explain likely cause.
01
Detect outages and degraded responses before customers have to explain the problem to you.
02
Publish branded status pages for client sites, SaaS products, e-shops, and grouped services.
03
Turn existing logs, errors, and deployment history into an AI incident diagnosis.
04
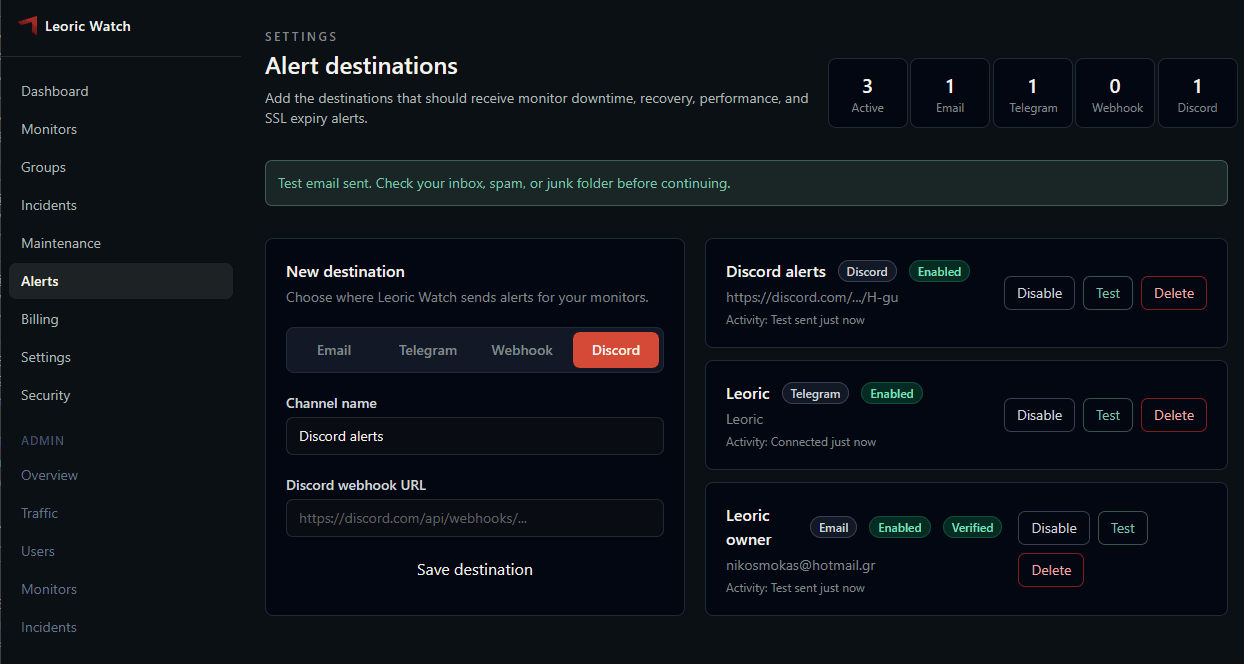
Route alerts through email, Telegram, Discord, webhooks, browser push, iPhone web app push, and Android.
AI Deep Diagnosis
Most uptime tools stop at down. Leoric helps explain why.
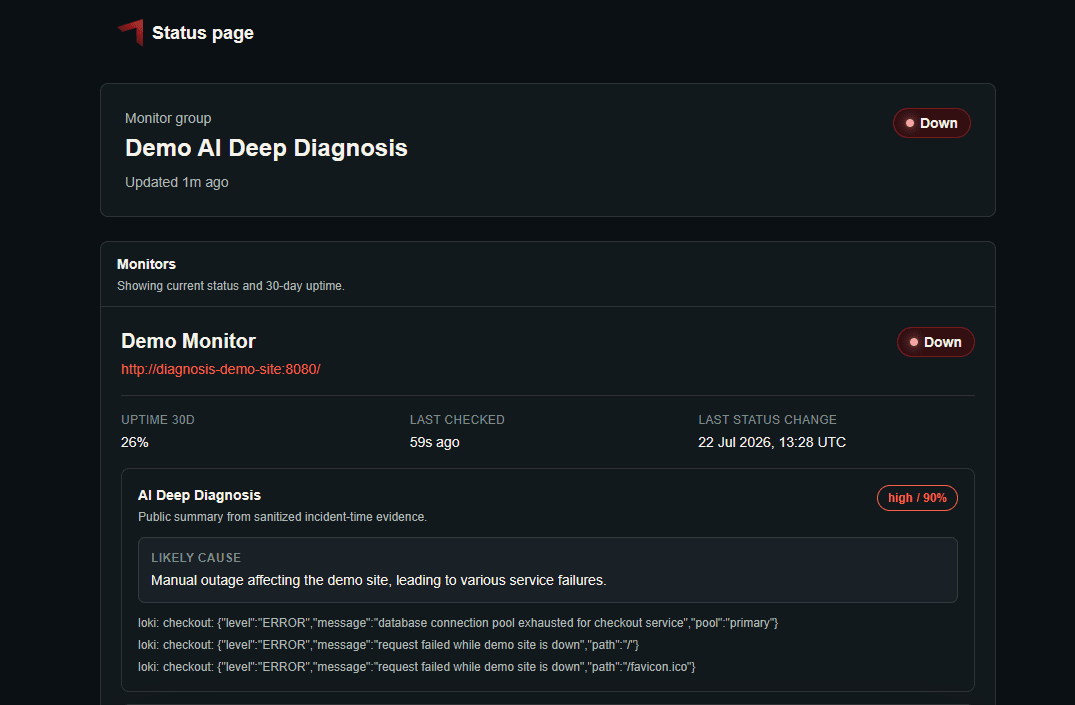
When an incident opens, Leoric can fetch a narrow incident-time window from connected read-only sources, sanitize and reduce the evidence, ask the configured model for a diagnosis, and attach the result to the incident.
- 1Incident opens from a failed monitor check.
- 2Leoric collects bounded evidence from sources that apply to that site or service group.
- 3Evidence is sanitized, reduced, and sent to Gemini 3.5 Flash Lite.
- 4The incident gets probable cause, confidence, supporting evidence, and next step suggestions.
Built for cautious teams
- Read-only connectors and encrypted credentials
- Private source URLs blocked by default in production
- No raw evidence archive after diagnosis processing
A practical monitoring workflow, not a hobby dashboard
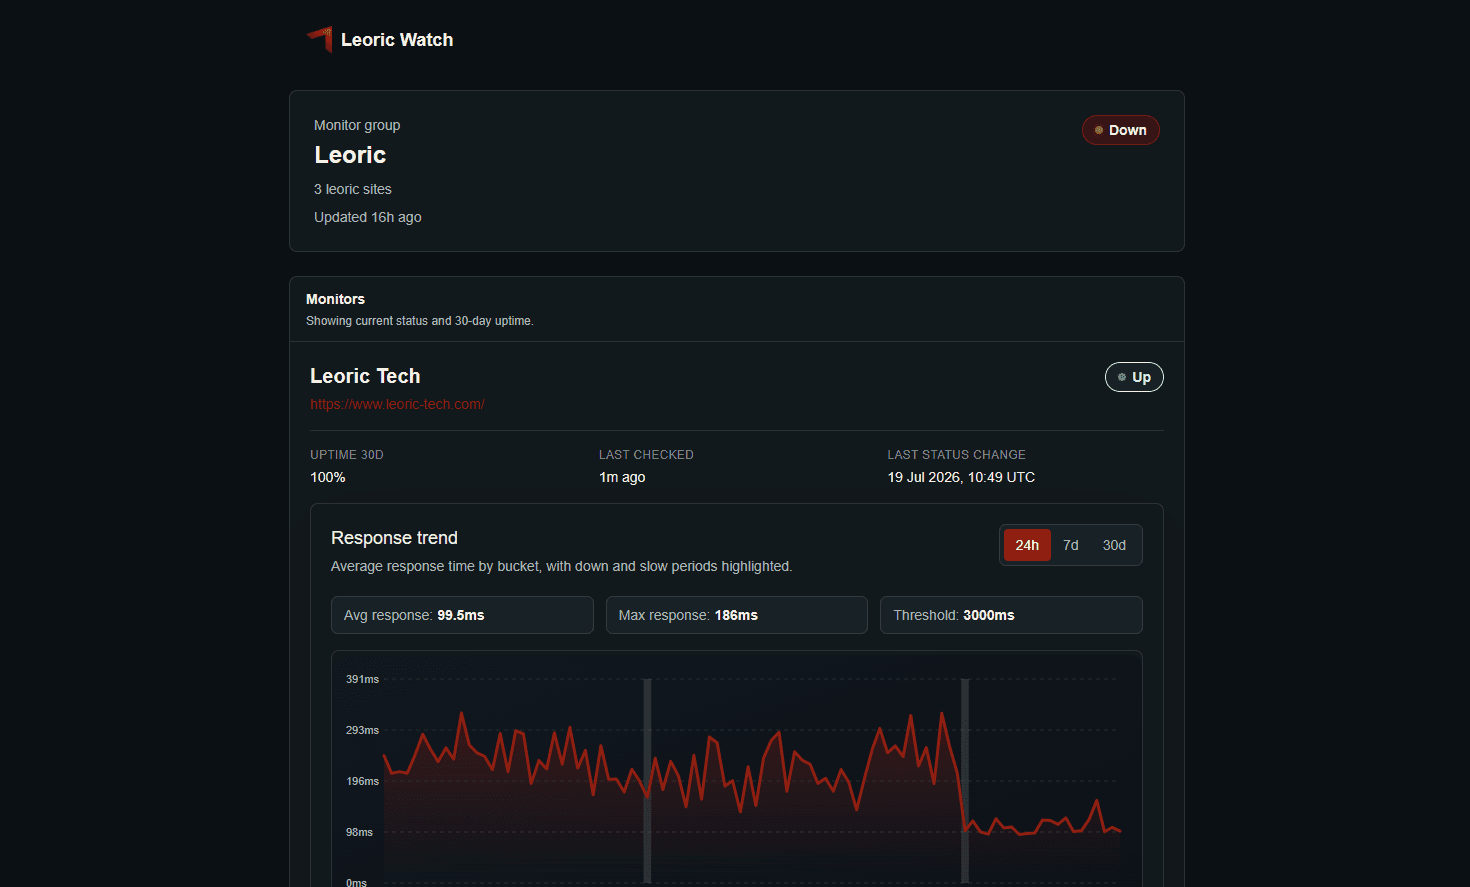
Scan client sites, business pages, e-shops, and production endpoints, then inspect issues, share individual status pages on free or branded status pages on paid plans, and route alerts from one focused workspace.
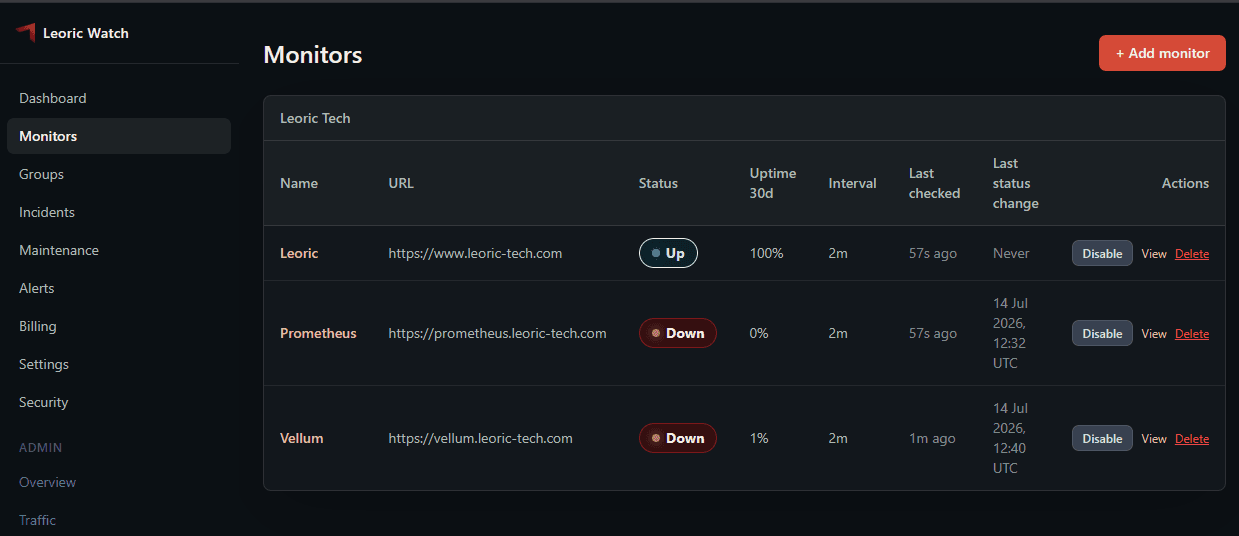
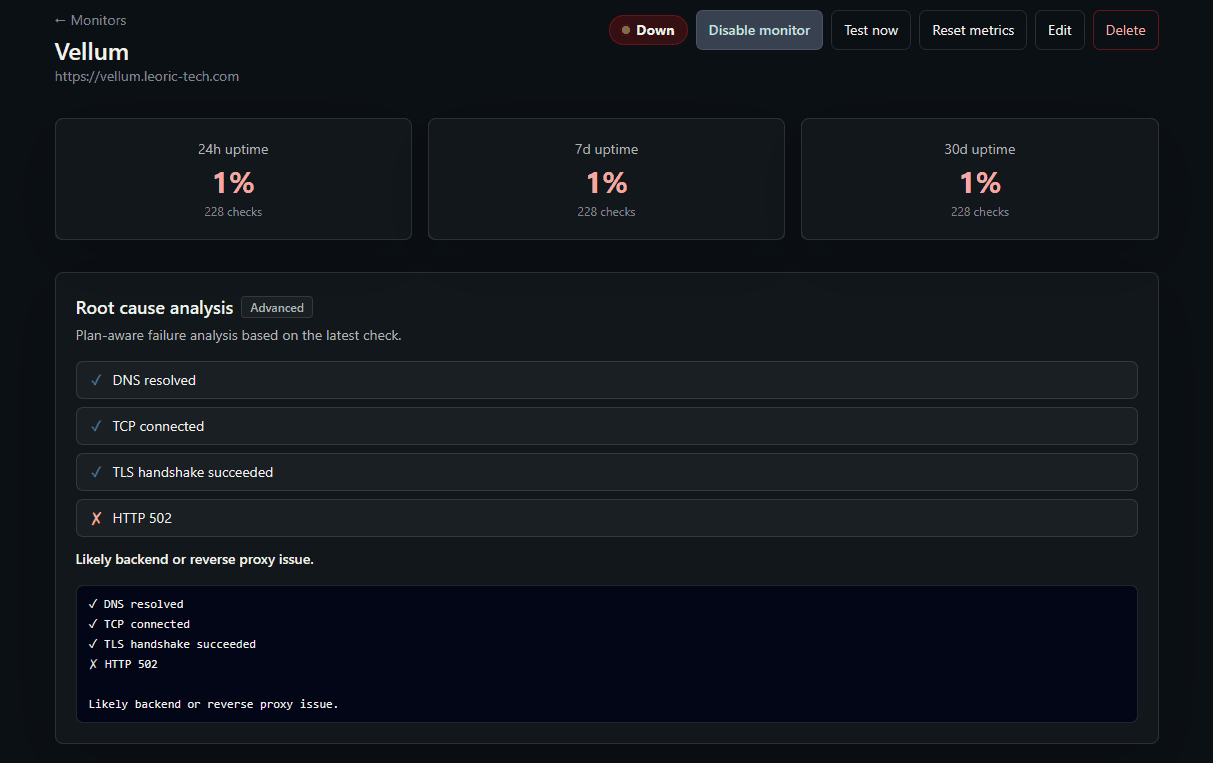
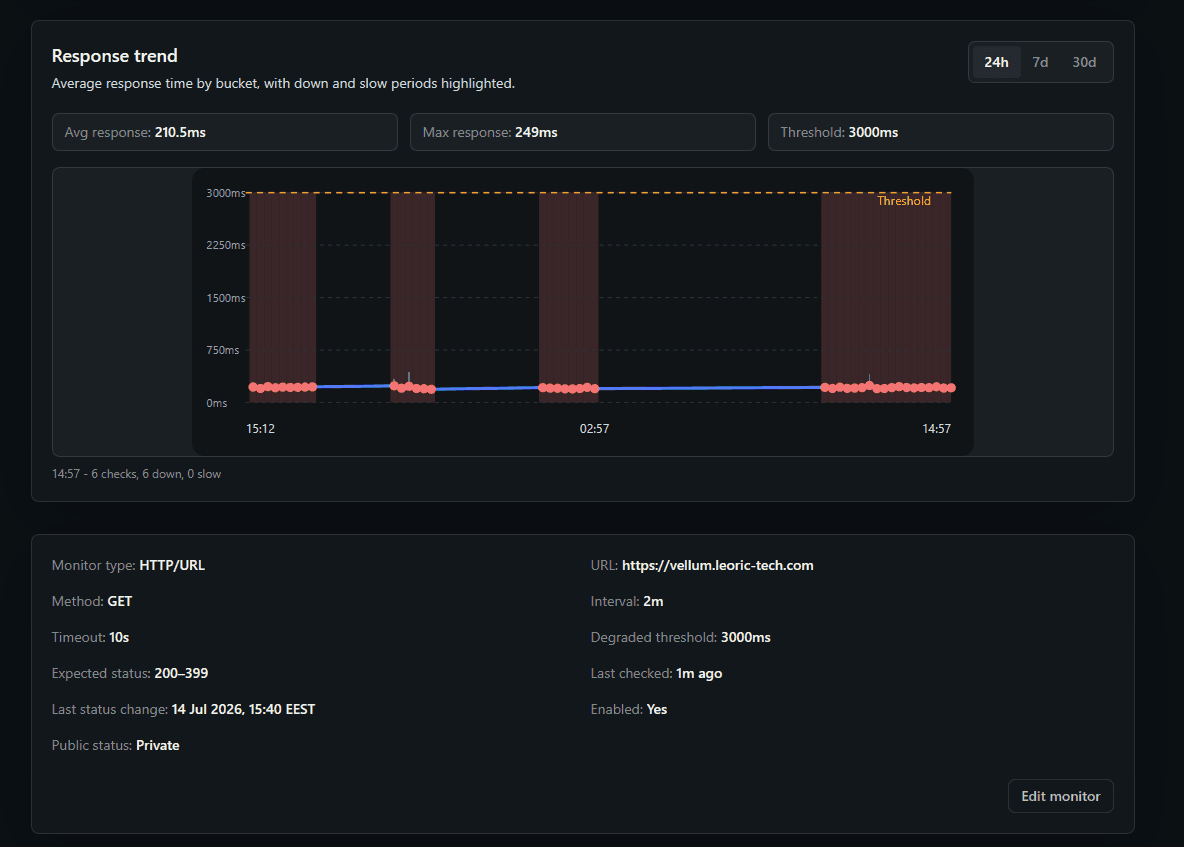
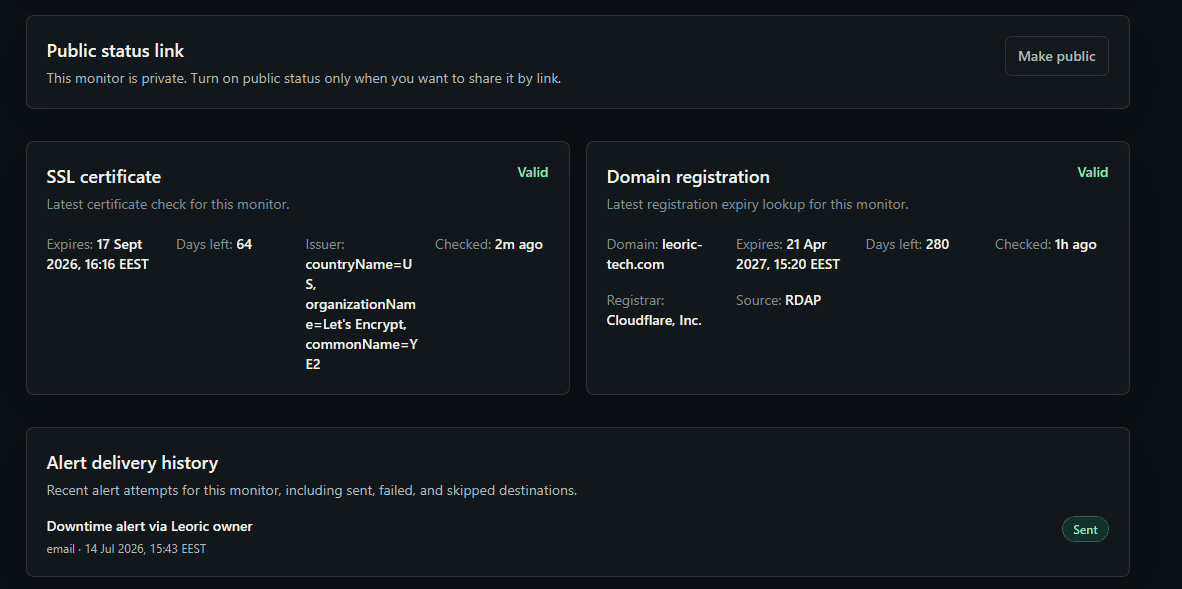
Site and endpoint overview
1 of 12
Pro feature
Status pages on your client's domain.
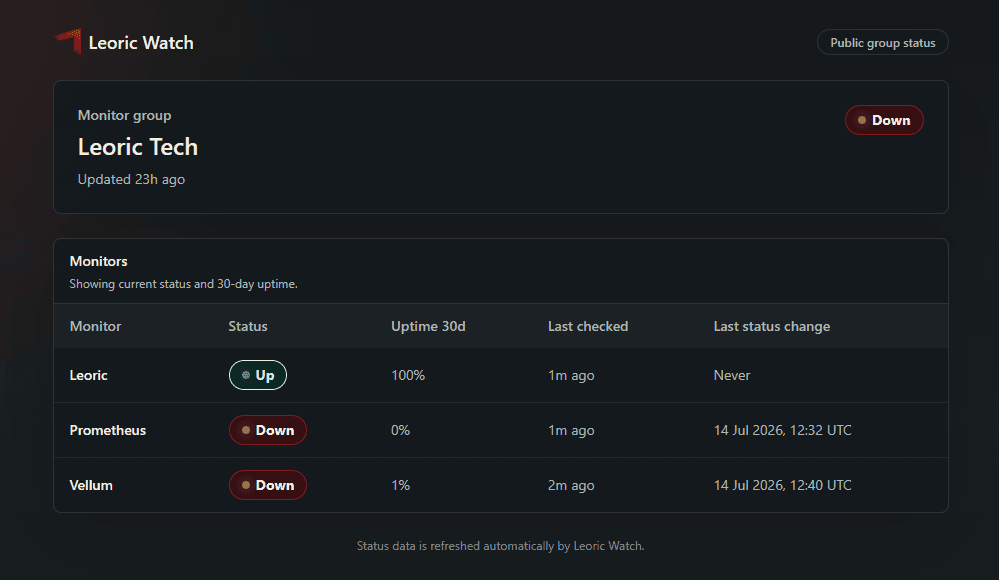
Publish a public status page at a client-owned hostname such as status.clientwebsite.com, with the client's own status profile and no Leoric Watch footer branding.
Custom domains include DNS ownership verification and managed HTTPS activation for up to three public group status pages per Pro account.
See Pro pricingPublic status
status.leoric-tech.comOpen a live white-label example
Client-branded status, served from their domain.
Alerts that leave the dashboard
Push notifications for desktop, iPhone web app, and Android.
When a monitor goes down, Leoric Watch can reach you through the channel you actually keep nearby: browser Web Push, an installed iPhone Home Screen web app, the Android companion app, email, Telegram, Discord, or webhooks.
Web Push for browsers and iPhone
Install Leoric Watch as a web app and receive W3C Web Push alerts without needing a native iOS app or Apple developer account.
Android companion app
Use the Android companion experience for mobile checks, status visibility, and push alerts when client sites need attention.
Installable PWA
The dashboard is built to live on the home screen, so alerts, reports, and monitor details stay one tap away.
Prometheus.com is down
from Leoric Watch
Browser and iPhone Web Push
Web Push, PWA install, desktop browser alerts
Android companion app
Android mobile alerts and companion access
Evidence after the alert
When something breaks, Leoric Watch keeps the details you need to explain what happened and confirm which destinations were notified.
- Incident history, recent checks, response trends, and SSL status stay attached to each monitor.
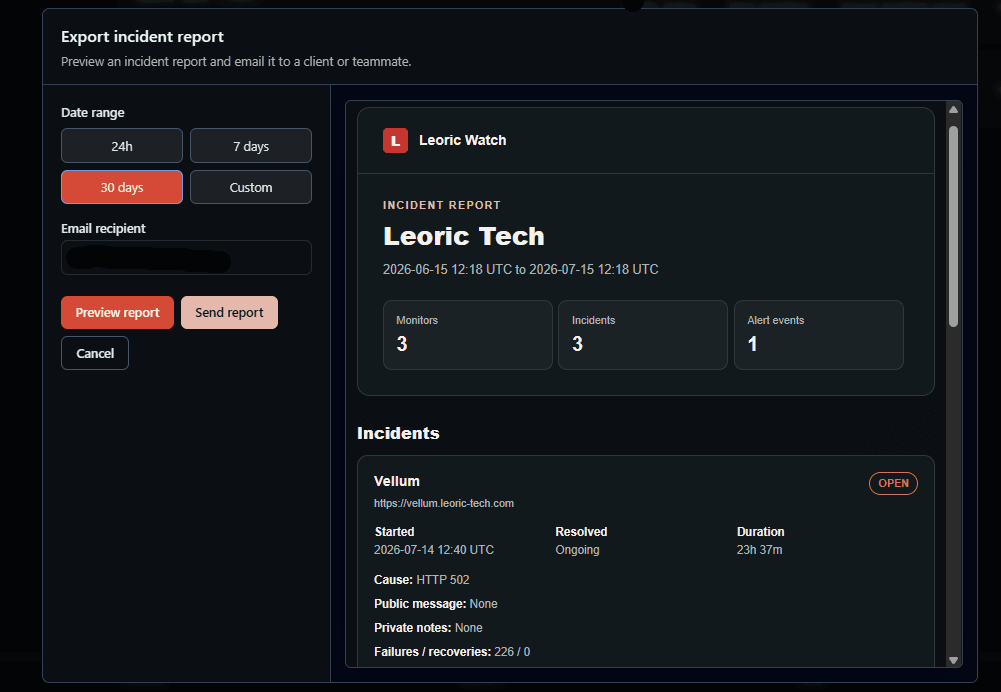
- Incident report exports help you package downtime evidence for clients or internal postmortems.
- Alert delivery history records sent, failed, and skipped attempts for each notification destination.
- Free plans can share individual monitor status pages with the default profile; paid plans add custom branded profiles and group status pages.
Switching from another monitor?
Move your monitoring setup in a controlled way: recreate the important checks, test notifications, and run both tools side by side before retiring the old one.
- 1Recreate your URLs, expected status ranges, intervals, and slow-response thresholds.
- 2Use the WordPress preset to generate homepage, admin login, REST API, and optional WooCommerce checks faster.
- 3Connect email, Telegram, Discord, or webhook destinations and send test alerts.
- 4Create individual public monitor links on free, or branded monitor/group status pages on paid plans.
- 5Run Leoric Watch alongside the old monitor for 24 hours before switching off the previous checks.

From Leoric Technologies
Leoric Watch is built by Leoric Technologies, an independent software lab focused on practical tools for operational work.
It is deliberately focused on uptime and response monitoring for paid projects and business sites: know when a client site, e-shop, API, or SSL certificate needs attention without adopting a full observability stack.
Learn more about the company